Experiments / Smoke diagnostics
DAFTSupports fire safety
Dust and Aerosol Measurement Feasibility Test
Checked that a commercial particle counter still works without gravity, so that the SAME smoke measurements could be trusted.
What burned
Nothing was burned
It tested an instrument, not a flame
Where
On the space station
In orbit, where everything is weightless
How much data
2 test days
NASA's table lists days, each with several flames
What they changed between tests
- instrument
- sampling location
What it found
The counter normally relies on gravity to recycle its working fluid, so it had to be modified and proven before SAME could use it.
NASA's words
“there were concerns that th P-Trak would not be reliable in microgravity as it relies on gravity to recycle isopropyl alcohol used in the measurement process” PSI record
Summarized by the SI. Each summary is tied to a quotation that the build checks against NASA's text. A matching quote is not a scientific review.
What it helps with
Stopping a fire from starting
Which materials burn, and in what air
Not an aim
Noticing a fire early
What smoke looks like to a detector
A clear part
Putting a fire out
What makes a flame go out
Not an aim
For researchers: NASA's full recordThe conditions tested, every row of the table, NASA's description, publications and hardware
Shared hardware: Particle counters and smoke detectors; one of the instruments was first proven in a dust test. Experiments that shared hardware share its limits, so their results can be compared directly.
Why it counts as fire-safety research
“One of the instruments used for smoke detection in the SAME and SAME-R studies was instead used to detect dust in the Dust and Aerosol Measurement Feasibility Test (DAFT and DAFT-2) studies.” NASA challenge statement
NASA's words behind each rating
- Prevention0 of 3
Not an aim of this investigation.
- Detection2 of 3
“This research will impact the development of novel fire and smoke detection systems for the International Space Station and future spacecrafts.”
- Suppression0 of 3
Not an aim of this investigation.
Conditions covered
- Oxygen in the atmosphere
- not reported
- airMoon
- not in the PSI table
- Pressure
- not reported
- Moonsea level
- not in the PSI table
- Flow speed
- not reported
- not in the PSI table
- Itemized rows
- 6
- 4 tests, 2 test days
Fuels and materials
ISS cabin air (3), Arizona Road Dust (Fine) (3)
Measurements named in the PSI record
- Aerosol counters
How the tests differ, and how they are the same
Worked out from the 6 rows of the PSI table. A variable that is not listed was not reported, which is different from being held fixed.
Changed from test to test
- Fuel or material
- 2 different values
- Particle number concentration (P-Trak)
- 1.43 particles/cm³ to 26,578 particles/cm³reported in 4 of 6 rows
- Particle mass concentration (DustTrak)
- 33.8 mg/m³ to 62.7 mg/m³reported in 3 of 6 rows
- Mass per particle (DustTrak mass over P-Trak count)
- 2.04e-12 g to 2.65e-12 greported in 3 of 6 rows
- Particle diameter from the mass per particle (assumed density)
- 1.57 µm to 1.72 µmreported in 3 of 6 rows
The same in every test
No variable has the same value in every row.
Reported for only some rows, with one value: geometry.
Rows from the PSI table
Click a row for the source of every value. Filter and export
| Record | Type | Fuel or material | Shape | Oxygen | Pressure | Flow, cm/s | Outcome | Date |
|---|---|---|---|---|---|---|---|---|
| DAFT-3 Sample Bag #1 (GMT 233, 2006) | Test | Arizona Road Dust (Fine) | not reported | not reported | 2006-08-21 | |||
| DAFT-3 Sample Bag #2 (GMT 233, 2006) | Test | Arizona Road Dust (Fine) | not reported | not reported | 2006-08-21 | |||
| DAFT-3 Sample Bag #3 (GMT 233, 2006) | Test | Arizona Road Dust (Fine) | not reported | not reported | 2006-08-21 | |||
| DAFT-3 Session D3, cabin air (GMT 229, 2006) | Test | ISS cabin air | not reported | not reported | ||||
| Session D1 | Test day | ISS cabin air | dust aerosol (no flame) | not reported | not reported | 2005-02-22 | ||
| Session D2 | Test day | ISS cabin air | dust aerosol (no flame) | not reported | not reported | 2005-03-04 |
How the table was read, and what was repaired
Tests added from other NASA files (PSI-47)
PSI-47_Evidence pack_PSI-47
4 rows in the file, 4 kept as records. These tests are not in PSI's experimental table. They were read from other NASA files, which are named on each value.
sha256 · fetched 2026-11-13
DAFT - instrument sessions
PSI-47_Experimental table_DAFT.csv
2 rows in the file, 2 kept as records. Instrument checkout with a dust aerosol standard. No combustion took place.
sha256 d9d1a436c6e7bbc410b433e04575fe7dedaff763b5237d688089929b7393b5c0 · fetched 2026-11-11
Repairs and warnings
- DAFT-3 Sample Bag #1 (GMT 233, 2006), Particle number concentration (P-Trak): NASA's file PSI-47_Analyzed Data_DAFT Retrieved Data Summary.xls gives 17236.3 particles/cm³; NASA's file PSI-47_Analyzed Data_DAFT Retrieved Data Summary.xls gives 17314.3 particles/cm³ (Voice Down Data Summary!B21). The first is the one used.
- DAFT-3 Sample Bag #1 (GMT 233, 2006), Particle number concentration (P-Trak): NASA's file PSI-47_Analyzed Data_DAFT Retrieved Data Summary.xls gives 17236.3 particles/cm³; NASA's file PSI-47_Analyzed Data_ISS_Daft_Aug21_0611zgy time hist.xls gives 17314.3 particles/cm³ (Data!C23). The first is the one used.
- DAFT-3 Sample Bag #1 (GMT 233, 2006), Particle number concentration (P-Trak): NASA's file PSI-47_Analyzed Data_DAFT Retrieved Data Summary.xls gives 17236.3 particles/cm³; NASA's file PSI-47_Analyzed Data_ISS_Daft_Aug21_06 urban.xls gives 17314.3 particles/cm³ (Data!B21). The first is the one used.
- DAFT-3 Sample Bag #2 (GMT 233, 2006), Particle number concentration (P-Trak): NASA's file PSI-47_Analyzed Data_DAFT Retrieved Data Summary.xls gives 16589.4 particles/cm³; NASA's file PSI-47_Analyzed Data_DAFT Retrieved Data Summary.xls gives 17256.2 particles/cm³ (Voice Down Data Summary!E21). The first is the one used.
- DAFT-3 Sample Bag #2 (GMT 233, 2006), Particle number concentration (P-Trak): NASA's file PSI-47_Analyzed Data_DAFT Retrieved Data Summary.xls gives 16589.4 particles/cm³; NASA's file PSI-47_Analyzed Data_ISS_Daft_Aug21_0611zgy time hist.xls gives 17256.2 particles/cm³ (Data!G23). The first is the one used.
- DAFT-3 Sample Bag #2 (GMT 233, 2006), Particle number concentration (P-Trak): NASA's file PSI-47_Analyzed Data_DAFT Retrieved Data Summary.xls gives 16589.4 particles/cm³; NASA's file PSI-47_Analyzed Data_ISS_Daft_Aug21_06 urban.xls gives 17256.2 particles/cm³ (Data!E21). The first is the one used.
- DAFT-3 Sample Bag #3 (GMT 233, 2006), Particle number concentration (P-Trak): NASA's file PSI-47_Analyzed Data_DAFT Retrieved Data Summary.xls gives 26578 particles/cm³; NASA's file PSI-47_Analyzed Data_DAFT Retrieved Data Summary.xls gives 24350 particles/cm³ (Voice Down Data Summary!H21). The first is the one used.
- DAFT-3 Sample Bag #3 (GMT 233, 2006), Particle number concentration (P-Trak): NASA's file PSI-47_Analyzed Data_DAFT Retrieved Data Summary.xls gives 26578 particles/cm³; NASA's file PSI-47_Analyzed Data_ISS_Daft_Aug21_0611zgy time hist.xls gives 24350 particles/cm³ (Data!K23). The first is the one used.
- DAFT-3 Sample Bag #3 (GMT 233, 2006), Particle number concentration (P-Trak): NASA's file PSI-47_Analyzed Data_DAFT Retrieved Data Summary.xls gives 26578 particles/cm³; NASA's file PSI-47_Analyzed Data_ISS_Daft_Aug21_06 urban.xls gives 24522.2 particles/cm³ (Data!H21). The first is the one used.
- DAFT-3 Sample Bag #1 (GMT 233, 2006), Particle mass concentration (DustTrak): NASA's file PSI-47_Analyzed Data_DAFT Retrieved Data Summary.xls gives 45.6343 mg/m³; NASA's file PSI-47_Analyzed Data_DAFT Retrieved Data Summary.xls gives 43.15 mg/m³ (Voice Down Data Summary!C21). The first is the one used.
- DAFT-3 Sample Bag #1 (GMT 233, 2006), Particle mass concentration (DustTrak): NASA's file PSI-47_Analyzed Data_DAFT Retrieved Data Summary.xls gives 45.6343 mg/m³; NASA's file PSI-47_Analyzed Data_ISS_Daft_Aug21_0611zgy time hist.xls gives 43.15 mg/m³ (Data!D23). The first is the one used.
- DAFT-3 Sample Bag #1 (GMT 233, 2006), Particle mass concentration (DustTrak): NASA's file PSI-47_Analyzed Data_DAFT Retrieved Data Summary.xls gives 45.6343 mg/m³; NASA's file PSI-47_Analyzed Data_ISS_Daft_Aug21_06 urban.xls gives 43.15 mg/m³ (Data!C21). The first is the one used.
- DAFT-3 Sample Bag #2 (GMT 233, 2006), Particle mass concentration (DustTrak): NASA's file PSI-47_Analyzed Data_DAFT Retrieved Data Summary.xls gives 33.8377 mg/m³; NASA's file PSI-47_Analyzed Data_DAFT Retrieved Data Summary.xls gives 34.0875 mg/m³ (Voice Down Data Summary!F21). The first is the one used.
- DAFT-3 Sample Bag #2 (GMT 233, 2006), Particle mass concentration (DustTrak): NASA's file PSI-47_Analyzed Data_DAFT Retrieved Data Summary.xls gives 33.8377 mg/m³; NASA's file PSI-47_Analyzed Data_ISS_Daft_Aug21_0611zgy time hist.xls gives 34.0875 mg/m³ (Data!H23). The first is the one used.
- DAFT-3 Sample Bag #2 (GMT 233, 2006), Particle mass concentration (DustTrak): NASA's file PSI-47_Analyzed Data_DAFT Retrieved Data Summary.xls gives 33.8377 mg/m³; NASA's file PSI-47_Analyzed Data_ISS_Daft_Aug21_06 urban.xls gives 34.0875 mg/m³ (Data!F21). The first is the one used.
- DAFT-3 Sample Bag #3 (GMT 233, 2006), Particle mass concentration (DustTrak): NASA's file PSI-47_Analyzed Data_DAFT Retrieved Data Summary.xls gives 62.6509 mg/m³; NASA's file PSI-47_Analyzed Data_DAFT Retrieved Data Summary.xls gives 63.1833 mg/m³ (Voice Down Data Summary!I21). The first is the one used.
- DAFT-3 Sample Bag #3 (GMT 233, 2006), Particle mass concentration (DustTrak): NASA's file PSI-47_Analyzed Data_DAFT Retrieved Data Summary.xls gives 62.6509 mg/m³; NASA's file PSI-47_Analyzed Data_ISS_Daft_Aug21_0611zgy time hist.xls gives 63.1833 mg/m³ (Data!L23). The first is the one used.
- DAFT-3 Sample Bag #3 (GMT 233, 2006), Particle mass concentration (DustTrak): NASA's file PSI-47_Analyzed Data_DAFT Retrieved Data Summary.xls gives 62.6509 mg/m³; NASA's file PSI-47_Analyzed Data_ISS_Daft_Aug21_06 urban.xls gives 63.2889 mg/m³ (Data!I21). The first is the one used.
- DAFT-3 Sample Bag #1 (GMT 233, 2006), Particle diameter from the mass per particle (assumed density): NASA's file PSI-47_Analyzed Data_DAFT Retrieved Data Summary.xls gives 1.71639 µm; NASA's file PSI-47_Analyzed Data_DAFT Retrieved Data Summary.xls gives 1.68213 µm (Voice Down Data Summary!B25). The first is the one used.
- DAFT-3 Sample Bag #1 (GMT 233, 2006), Particle diameter from the mass per particle (assumed density): NASA's file PSI-47_Analyzed Data_DAFT Retrieved Data Summary.xls gives 1.71639 µm; NASA's file PSI-47_Analyzed Data_ISS_Daft_Aug21_0611zgy time hist.xls gives 1.68213 µm (Data!C27). The first is the one used.
- DAFT-3 Sample Bag #1 (GMT 233, 2006), Particle diameter from the mass per particle (assumed density): NASA's file PSI-47_Analyzed Data_DAFT Retrieved Data Summary.xls gives 1.71639 µm; NASA's file PSI-47_Analyzed Data_ISS_Daft_Aug21_06 urban.xls gives 1.68213 µm (Data!B25). The first is the one used.
- DAFT-3 Sample Bag #2 (GMT 233, 2006), Particle diameter from the mass per particle (assumed density): NASA's file PSI-47_Analyzed Data_DAFT Retrieved Data Summary.xls gives 1.57347 µm; NASA's file PSI-47_Analyzed Data_DAFT Retrieved Data Summary.xls gives 1.55674 µm (Voice Down Data Summary!E25). The first is the one used.
- DAFT-3 Sample Bag #2 (GMT 233, 2006), Particle diameter from the mass per particle (assumed density): NASA's file PSI-47_Analyzed Data_DAFT Retrieved Data Summary.xls gives 1.57347 µm; NASA's file PSI-47_Analyzed Data_ISS_Daft_Aug21_0611zgy time hist.xls gives 1.55674 µm (Data!G27). The first is the one used.
- DAFT-3 Sample Bag #2 (GMT 233, 2006), Particle diameter from the mass per particle (assumed density): NASA's file PSI-47_Analyzed Data_DAFT Retrieved Data Summary.xls gives 1.57347 µm; NASA's file PSI-47_Analyzed Data_ISS_Daft_Aug21_06 urban.xls gives 1.55674 µm (Data!E25). The first is the one used.
- DAFT-3 Sample Bag #3 (GMT 233, 2006), Particle diameter from the mass per particle (assumed density): NASA's file PSI-47_Analyzed Data_DAFT Retrieved Data Summary.xls gives 1.65121 µm; NASA's file PSI-47_Analyzed Data_DAFT Retrieved Data Summary.xls gives 1.70491 µm (Voice Down Data Summary!H25). The first is the one used.
- DAFT-3 Sample Bag #3 (GMT 233, 2006), Particle diameter from the mass per particle (assumed density): NASA's file PSI-47_Analyzed Data_DAFT Retrieved Data Summary.xls gives 1.65121 µm; NASA's file PSI-47_Analyzed Data_ISS_Daft_Aug21_0611zgy time hist.xls gives 1.70491 µm (Data!K27). The first is the one used.
- DAFT-3 Sample Bag #3 (GMT 233, 2006), Particle diameter from the mass per particle (assumed density): NASA's file PSI-47_Analyzed Data_DAFT Retrieved Data Summary.xls gives 1.65121 µm; NASA's file PSI-47_Analyzed Data_ISS_Daft_Aug21_06 urban.xls gives 1.70186 µm (Data!H25). The first is the one used.
- Session D1, Particle number concentration (P-Trak): NASA's file PSI-47_Analyzed Data_DAFT Flight Data GMT053.xls gives 1.43189 particles/cm³; NASA's file PSI-47_Reports_DAFT_FinalReport.doc gives 2 to 5 particles/cm³ (section II.D.1 (DAFT-1 & DAFT -2, Session 1, GMT 54, 2005)). The first is the one used.
NASA's description
Objectives
The focus of DAFT / DAFT-2 was to mitigate the risk for the Smoke Aerosol Measurement Experiment (SAME). SAME relied on a commercially available condensate nuclei counter, the TSI P-Trak, to quantify smoke aerosols in a microgravity environment, however there were concerns that th P-Trak would not be reliable in microgravity as it relies on gravity to recycle isopropyl alcohol used in the measurement process. DAFT / DAFT-2 tests that a modified P-Trak particulate counter would be accurate in microgravity. Summarized objectives include: 1) Demonstrate the Functionality of the Modified TSI P-Trak in Microgravity 2) Compare the TSI P-Trak Performance against the DustTrak control 3) Create and Analyze Aerosol Standards in Microgravity 4) Ensure the reliability of future aerosol experiments
Approach
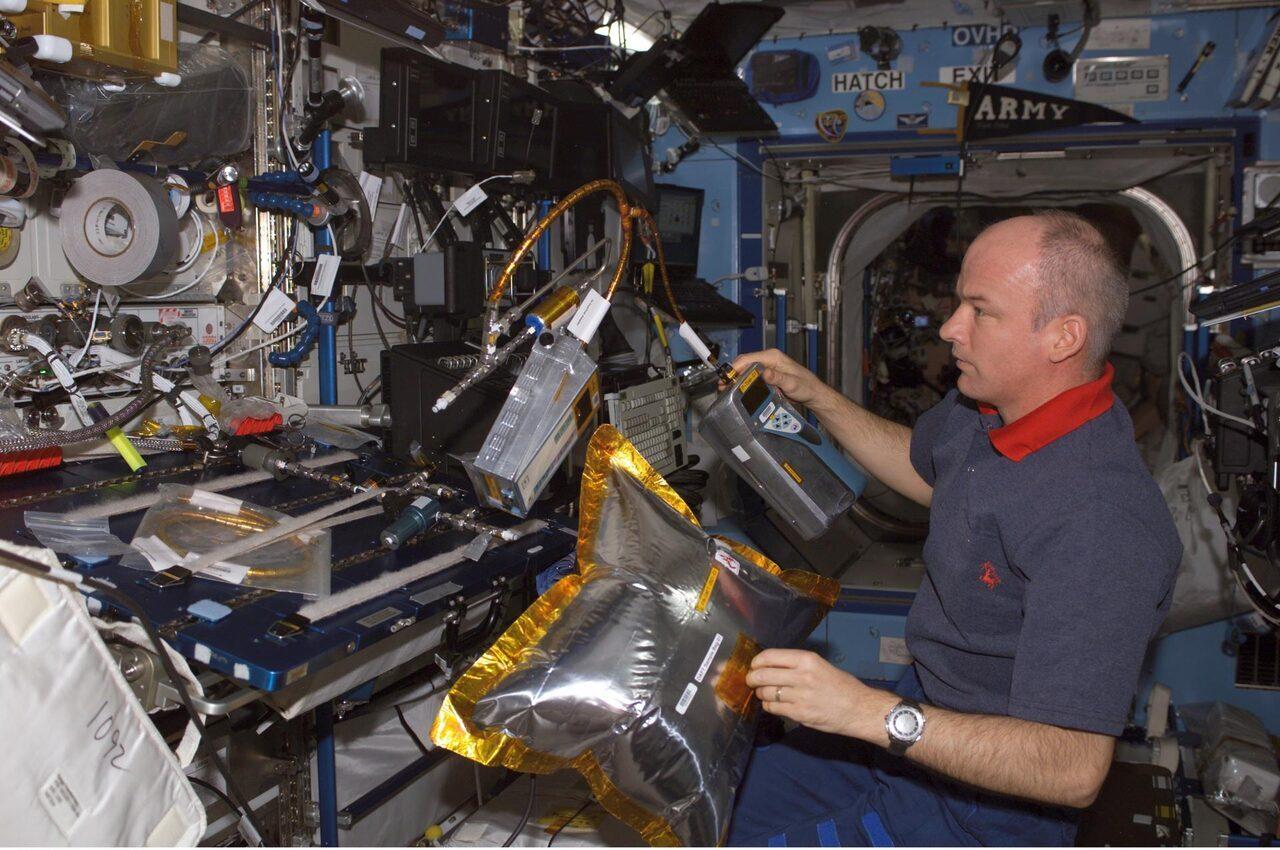
The experimental approach consists of the following components: 1) Modification of Instrumentation: TSI P-Trak was modified for use in microgravity by redesigning the condenser tube to use capillary forces for recycling isopropyl alcohol and removing the mercury switch responsible for detecting instrument orientation. 2) Aerosol Generation: Arizona Red Dust (ARD) was chosen as an aerosol standard due to its ease of dispersion. The ARD was aerosolized with GN2 to create particle samples. The aerosol was contained within 15-liter Mylar bags. 3) On-Orbit Testing: The modified P-Trak gathered data from counting aerosol particles and these data were compared to the DustTrak CNC specifically designed to work in microgravity.
Hypothesis
The TSI P-Trak operates by condensing isopropanol around aerosol particulates that are subsequently laser counted. It was hypothesized that the P-Trak would not work in microgravity due to two potential failure modes that exist. 1) the system would clog or become obscured by isopropanol, and 2) the internal air-flow dynamics of the optics chamber of the device will cause an over counting of particulates. The TSI P-Trak was modified for microgravity use via using capillary action to recycle the isopropanol. Therefore, there are two basic hypotheses: 1) that the P-Trak, as modified for use in SAME, would function normally in microgravity. 2) that the aerosol created and filtered per the experiment design would be within the measurement capabilities of the test devices.
Research impacts and Earth benefits
Extended duration space flight missions with larger vessels will require fire detection systems with increased reliability and sensitivity. This research will impact the development of novel fire and smoke detection systems for the International Space Station and future spacecrafts. Additionally, the successful adaptation of the TSI P-Trak for microgravity can inform the design of instruments for use in other challenging Earth environments, such as submarines or underwater laboratories where accurate detection of smoke can save lives.
Publications
2 listed in PSI, 2 with a DOI.
- A Research Plan for Fire Prevention, Detection and Suppression in Crewed Exploration SystemsRuff Gary, Urban David, King Merrill
- Detection of Smoke from Microgravity FiresUrban David, Griffin DeVon, Ruff Gary, Cleary Thomas, Yang Jiann, Mulholland George, Yuan Zeng-guang
Hardware and raw data
41.8 MB of raw data on PSI: reports 3, raw data 6, metadata 1, analyzed data 12, presentations 3, engineering documents 6, representative image(s) 1. FlameLens reads the experimental table, not the raw video or sensor files.
Linked investigations
On Earth
Smoke detection: The modified instrument design carries over to other sealed environments.
“such as submarines or underwater laboratories where accurate detection of smoke can save lives”